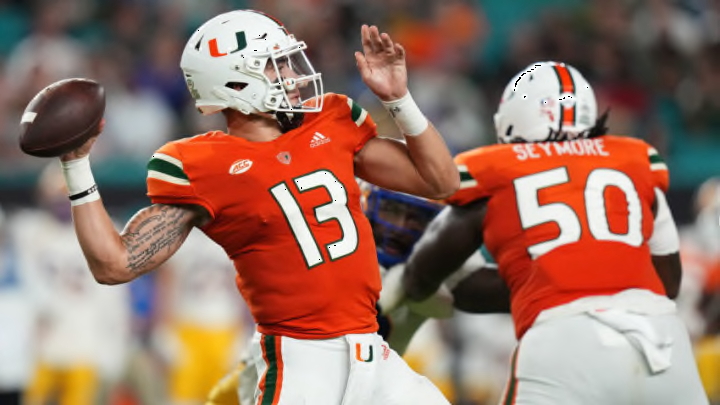
Texas A&M Football: Schedule Preview – Miami

With all that said, let’s take a look at what 2022 looked like for Miami. They opened strong with an impressive-looking win over outmatched Bethune-Cookman, putting up 70 points. They looked far less impressive the next week, notching a 30-7 win over Southern Miss that was closer than many Hurricane fans would have liked. Week 3, of course, saw Miami lose at Kyle Field. The following week, however, was the lowlight of the Hurricanes’ season, losing 39-25 to Middle Tennessee State. Things spiraled from there, culminating in a lowly 5-win total for the Hurricanes, including back-to-back losses to Clemson and Pitt with a bowl game on the line.
Though the Aggies had an identical record to the Hurricanes in 2022, the numbers told very different stories about each team. Let’s start with the SP+ numbers and then take a look at the more specific metrics. The Aggies closed the year with a 10.1 rating, good for 35th overall. They were the highest rated team with five wins or fewer in the nation—faint praise, but relevant for this comparison. They finished two spots higher than nine-win Notre Dame and four spots higher than nine-win Pittsburgh. The Hurricanes, on the other hand, finished with a -2.2 rating and 74th overall.
As poor as the Aggie offense was last year, Miami’s was worse per Bill Connelly’s numbers—Texas A&M football had an offensive rating of 25.4 (72nd in the nation) while Miami had an offensive rating of 24.8 (77th in the nation). The real difference between the two was in defensive quality—the Aggies had a defensive rating of 15.6 (18th overall) and the Hurricanes had a defensive rating of 28.7 (74th overall).
The defensive quality of each team helps tell the story a bit here as far as the disparity in rating between the two. Digging in a little bit more with some of my own numbers, I found a couple of interesting notes. Texas A&M football ended with poor offensive numbers across the board, as most Aggie fans might suspect. One number I tracked throughout the season was points per play, hoping to measure overall scoring efficiency, and adjusting that number for opponent quality. For the year, the Aggies’ adjusted offensive points per play was 0.342 (for context, this was the third-worst mark in the SEC). Miami’s number for the season was a mere 0.263. This was worse than even Vanderbilt’s.
The Aggies averaged 86.91% of opponent offensive points per play allowed, while Miami averaged only 76.88% of the same number—neither were stellar marks, but the Aggies were substantively better with regard to opponent-adjusted scoring efficiency. On a yardage basis, the numbers look similarly dour for the Hurricanes. They only averaged 90.44% of opponent yards per attempt allowed and 81.12% of opponent yards per carry allowed. So not only could the Hurricanes not score efficiently, they were poor at gaining yardage as well. The Aggies averaged 92.71% of opponent yards per attempt allowed and 109.23% of opponent yards per carry allowed.
Turning now to the defensive mirrors of the aforementioned numbers, the disparity is shown in even sharper relief. The Aggies allowed an adjusted points per play number of 0.258. This was the third-best number in the SEC behind Alabama and Georgia, so for all the grousing about DJ Durkin’s defense, that unit performed far above expectations when it came to keeping opponents out of the end zone. Miami, on the other hand, allowed 0.399 adjusted points per play (this would have been good for 13th in the SEC).
When facing Miami, teams tended to exceed their own average scoring efficiency by just a touch—the Hurricanes allowed 106.47% of opponent average points per play. Texas A&M, on the other hand, held opponents well below their average scoring efficiency, allowing only 68.43% of opponent average points per play—only Mississippi State and Florida exceeded their season averages against Texas A&M football. Miami featured a porous pass defense for most of the season, allowing 120.55% of opponent passing averages on a per-attempt basis, including a horrendous 242.56% against Middle Tennessee, who hit long shot after long shot against the Hurricanes. Their rushing defense was a bit better, holding opponents to 93.27% of their averages on a per-carry basis—though this tailed off towards the end of the season, when Georgia Tech and Pitt (two of the Hurricanes final three opponents) far exceeded their season averages. The Aggies, as many Texas A&M football fans might sense, had the converse issue. They were a bit more stingy through the air—allowing 92.71% of opponent averages on a per-attempt basis—but struggled in run defense, allowing 105.39% of opponent averages on a per-carry basis.
Though these two teams ended with the same record, these are massively different statistical profiles, which are reflected in Connelly’s overall SP+ ratings. So how do they compare going into 2023? Let’s look at that next.