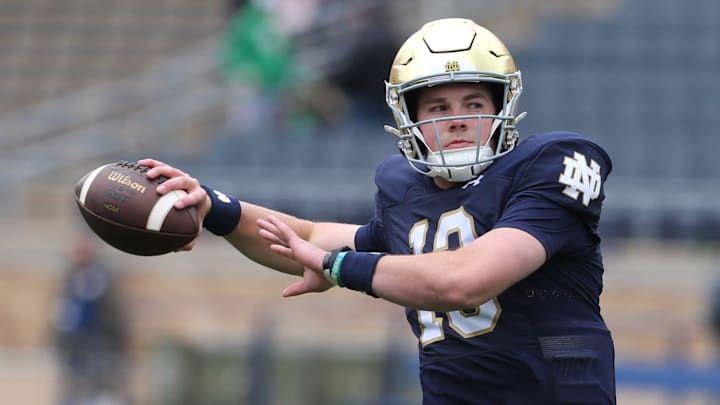
Is Notre Dame QB Riley Leonard being overhyped ahead of Texas A&M football's matchup with the Irish?
With the impending matchup between Texas A&M football and Notre Dame set to be the highlight of week one, fans all around the country are turning their attention to what the Aggies and Irish may have in store. The matchup down in College Station will feature not only two highly-rated defenses, but two of the better-known quarterbacks in the nation: Conner Weigman and Riley Leonard.
One of the interesting storylines for this game in particular is the fact that Leonard played his last two years under Mike Elko at Duke. While in Durham, he was a fan favorite, leading the Blue Devils to a memorable season-opening victory over Clemson under Elko's tutelage.
Now, though, he will be facing off against the defensive mastermind. It will be one of the more hyped aspects of the game, given the two's history and the stature in which Leonard is now considered.
It's worth asking, though, when you look at the numbers, if Leonard isn't just the tiniest bit overhyped.
I know, I know. Maroon-colored kool-aid. But bear with me for a moment.
Let's do a quick blind comparison of quarterbacks. I'll include here rate-based rather than total stats (given that Leonard didn't play the whole year), as well as an advanced stat called PPA/Play (from collegefootballdata.com), which you can think of as a catch-all metric that describes a player's value. Handily, not only is it opponent-adjusted, it also filters out garbage time—so no stat-padding against weak opponents or late in games is included.
Quarterback A | Quarterback B | |
|---|---|---|
Yards/Attempt | 7.6 | 6.7 |
Total Yards/Game | 184.9 | 207.7 |
Total TDs/Game | 1.38 | 1 |
Interceptions/Game | 0.63 | 0.43 |
Completion Pct. | 62.1% | 57.6% |
PPA/Play | 0.365 | 0.297 |
I think you can probably surmise that one of these two quarterbacks is Riley Leonard from last year. Given the point of this article, I think you can also likely surmise that he is Quarterback B.
The thing that may surprise you is that Quarterback A is none other than Max Johnson in 2023.
That's right: Max Johnson, who Aggie fans constantly grumbled and groaned about throughout the whole year, and who was the focus of so much ire as a guy who just couldn't get it done, compares very favorably—some would say transcends—Riley Leonard, even when you include rushing statistics.
But is this giving Leonard a fair shake? After all, he was playing with a far less talented team in Durham than he will be in South Bend.
Let's do another comparison, this time with another unknown quarterback.
Max Johnson 2023 | Riley Leonard 2023 | Quarterback C | |
|---|---|---|---|
Yards/Attempt | 7.6 | 6.7 | 8.6 |
Total Yards/Game | 184.9 | 207.7 | 319.2 |
Total TDs/Game | 1.38 | 1 | 3.25 |
Interceptions/Game | 0.63 | 0.43 | 1 |
Completion Pct. | 62.1% | 57.6% | 63.1% |
PPA/Play | 0.365 | 0.297 | 0.400 |
Quarterback C looks to be the best of the bunch here. With the exception of interceptions per game, he has the other two beaten in every single category.
Quarterback C is Sam Hartman, the year before he went from Wake Forest to Notre Dame.
In other words, we should in no way expect Leonard to take a huge step up just because he's now quarterbacking the Irish. Hartman was already putting up huge numbers before he made the move to South Bend.
Maybe new OC Mike Denbrock can completely change things around. But Duke OC Kevin Johns, by any stretch, is a capable and creative playcaller. If anything, I'd be worried about whether Denbrock is a made man by virtue of coaching Jayden Daniels alone.
Undoubtedly, the strongest part of Leonard's game is his legs. The Aggies will have to be ready to keep him inside the pocket—he's really a great athlete in the open field. But the numbers tell me that his accuracy has been a struggle, and considering the secondary and pass rush he's going up against, he could be in for a long night.
Just for fun, I threw Weigman's games in the comparison as well.
Max Johnson 2023 | Riley Leonard 2023 | Conner Weigman 2023 | |
|---|---|---|---|
Yards/Attempt | 7.6 | 6.7 | 8.2 |
Total Yards/Game | 184.9 | 207.7 | 260.5 |
Total TDs/Game | 1.38 | 1 | 2.5 |
Interceptions/Game | 0.63 | 0.43 | 0.5 |
Completion Pct. | 62.1% | 57.6% | 68.9% |
PPA/Play | 0.365 | 0.297 | 0.540 |
There's some pretty clear levels here. BTHOIrish.
